

Executive Summary
NVIDIA launched Minerva on 22 October, an AIOps platform that takes telemetry from GPUs, NVLink switches, Spectrum-X Ethernet, SuperNICs, DPUs, schedulers and the workloads themselves, and puts all of it on one topology graph. IREN, Lambda, IBM, Jio, Tesla, Bitdeer AI, Quake AI and Aolani plan to deploy it. Dell, Lenovo and Supermicro will carry it inside their AI factory operations portfolios.
It sells on AI factory yield, which counts output rather than activity. That is the right scoreboard, because a cluster can hold every clock at full speed and still produce nothing useful. The verdict is that the correlation layer carries the value and the AI assistant is packaging. Tying one stretched job to one failing component solves a problem that three separate teams currently fail to solve together.
A rack of 72 GPUs starts a training step together. One of them runs hot enough to throttle. The collective waits for its slowest participant, so 71 accelerators sit near idle while the job gets longer and the meter keeps running.
That is where an AI factory loses most of its money, and it is not the failure the monitoring was built for. A dead node pages somebody. A degraded one just makes everything slower, and the page never comes.
The leak hides in the gaps between three teams
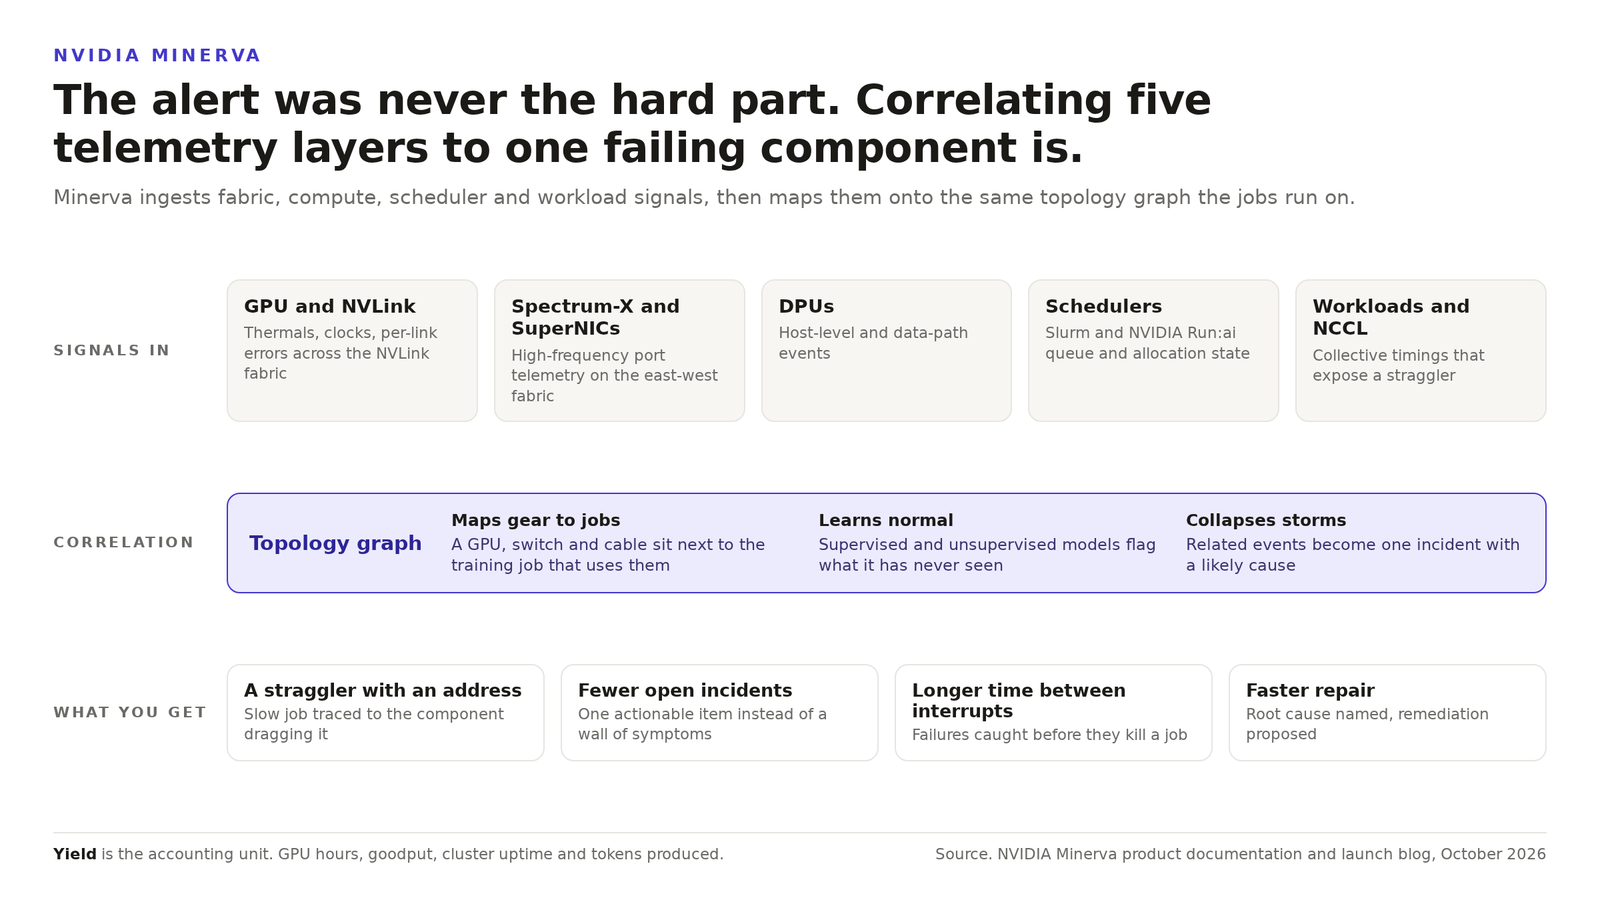
NVIDIA shipped a shared map. NVIDIA Minerva reads telemetry from the silicon and the fabric, and scheduler state from Slurm and NVIDIA Run:ai, then builds a knowledge graph that knows which cable sits under which switch and which job is using that path.
Without that key, the evidence scatters. Networking sees port counters. Site reliability sees uptime. The training team sees a loss curve that will not converge. Nobody can prove the straggler is an NVMe drive shedding throughput under load, because the three observations live in three systems with nothing in common.
NVIDIA says Minerva reads billions of data points per hour, learns what normal looks like for a given factory, and folds an event storm into a single incident with a probable cause. The folding is the point. An operator handed 400 alerts has 400 problems. An operator handed one has a repair.
Goodput is the honest half of the metric
The platform sells on AI factory yield, which NVIDIA defines as GPU hours, goodput, cluster uptime and tokens produced. Goodput is the one that keeps a fleet honest. It counts work that finished usefully, so a cluster burning full power on retried steps scores badly while every gauge sits in the green.
The deployment shape says what NVIDIA thinks this is. Minerva sits inside the Vera Rubin platform and inside DSX OS, where a Minerva Collector correlates GPU telemetry with facility level signals. Being inside the stack is the difference between a dashboard that needs a data pipeline built for it and one that arrives with the cabling diagram already loaded.
The vendor now ships the instrument and the reading
Read the adopter list against everything else NVIDIA sells, which is the GPU, the NVLink fabric, the rack, the reference design and the scheduler integration. The operations layer was the last gap. It also happens to produce the number that says whether the rest of it was worth buying.
None of that is sinister. Platform vendors consolidate, and the correlation problem is genuinely hard. It does mean an operator should keep a yardstick that does not come from the same company as the hardware. We have written about the buffers that buy time when a component degrades, from spare GPUs inside the rack to the purchasing math that changes when you buy a system instead of a server. A yield platform changes none of it. It only makes the loss visible sooner, and sooner is worth money.
There is a second use for the graph. A neocloud selling GPU hours and an enterprise buying them argue about utilization, and the side holding the telemetry tends to win that argument. Worth knowing before the renewal meeting.
Three questions for your own factory. Can you tie a slow job to a specific component today, or do you find out when the run lands late? If your hardware vendor produces the yield number, what independent measure do you keep? And how many degraded components are unowned right now because no single team dashboard shows them?
Related reading. Our piece on NodeWright and fleet maintenance covers the upkeep side of the same problem.
Get the next one before it is old news
Independent analysis of cloud-native infrastructure, Kubernetes and data center economics. No vendor spin.