


Executive Summary
NVIDIA shipped an Apache 2.0 service that watches a training cluster and restarts what breaks. Over ninety days on one internal cluster it recorded about 8,550 anomaly detections across nearly 200 jobs a day, with a mean 69 seconds to detect an interruption and 94 seconds to act on it. Read that as an operations baseline, not a reliability guarantee. The cluster is unnamed, the sample is one, and the project’s own README calls the code experimental and not ready for production.
The finding that matters for anyone renting GPUs is where the published clock stops. Detection and action latency say nothing about time to the first useful training step, because rescheduling, image pull and weight reload from storage all happen after the action. What actually sets the cost of a restart is checkpoint cadence, and this release does not touch it. Automation moves the cost from operator attention to storage throughput. That trade is worth making. It is not free, and nothing in the vendor numbers measures it yet.
Training failure is not an outage. It is a slow leak. A job spread across thousands of GPUs does not stop when one rank dies, it stalls, and the whole collective waits inside an all-reduce for a node that is never coming back.
NVIDIA Recovery catches that. It is an Apache 2.0 control plane service that sits above the scheduler rather than inside it, and it is part of NVIDIA DSX OS.
It reads application logs, GPU metrics and scheduler signals. It classifies the interruption as hardware, system software or application fault, excludes the implicated nodes from the next attempt, and resumes the job from its last saved checkpoint. Slurm gets a reference Advisor Controller shipped as a Helm chart, in-cluster or over SSH. Every deployment starts in monitor mode, publishing advice without touching the scheduler, and an audit trail records every decision.
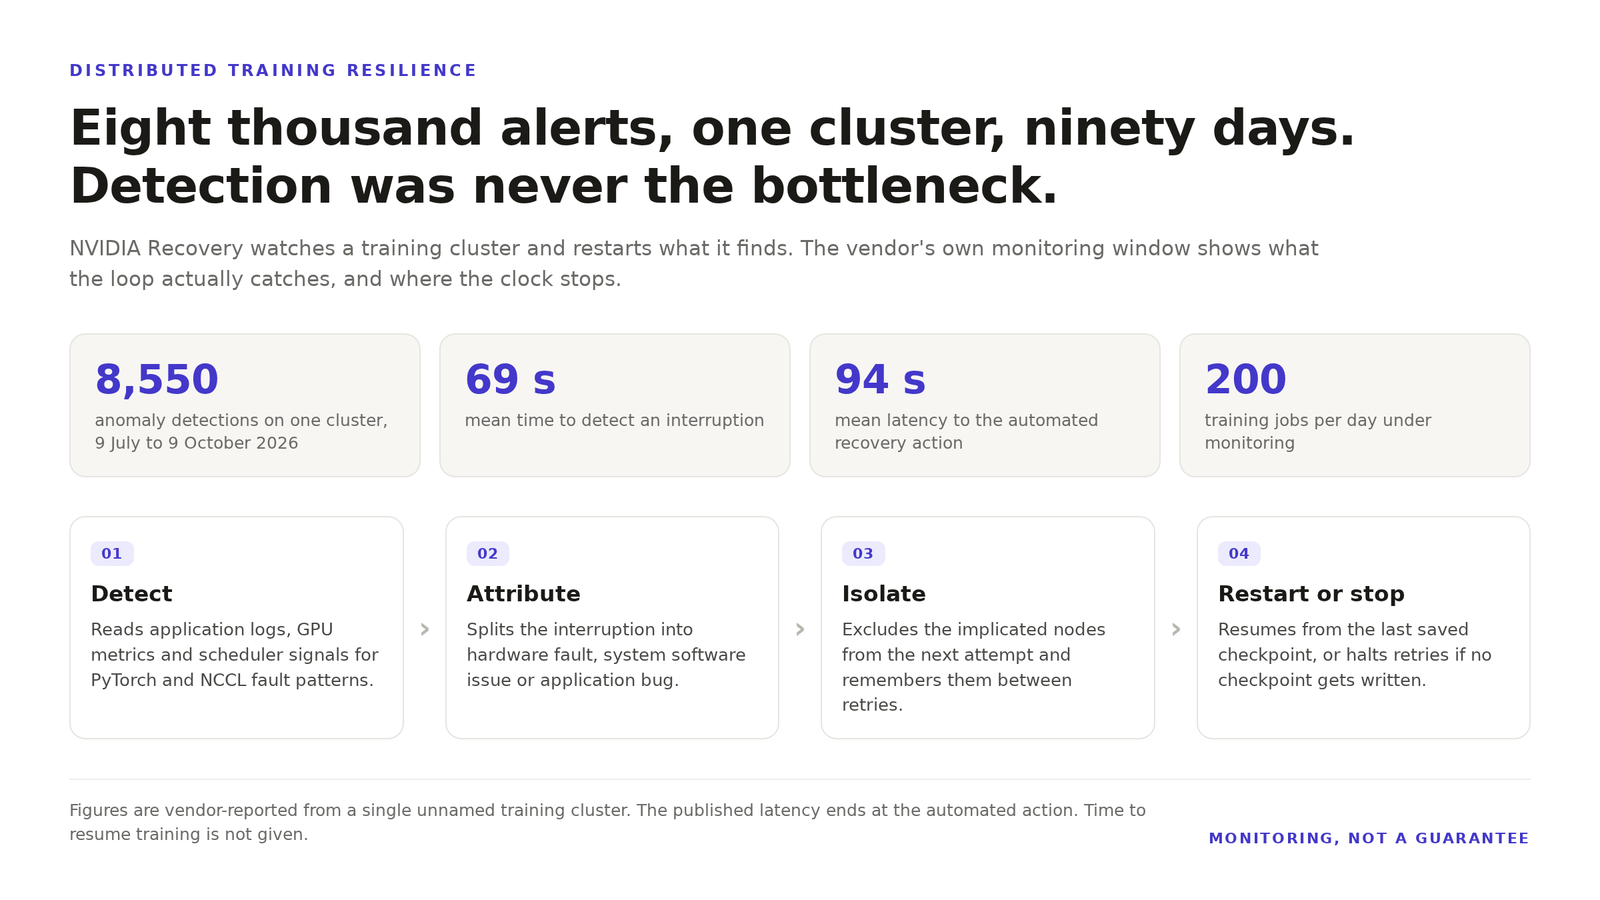
The published clock stops at the action, not at the resume
Ninety four seconds of mean recovery latency reads like the whole loop. It is not. NVIDIA states the number ends at the automated action. Rescheduling, container start, image pull and the reload of the last checkpoint all land after that, and none of them are inside it.
The arithmetic that makes this matter is unforgiving. If each GPU survives a given day with 99.9 percent probability, a job spanning 10,000 GPUs completes that day uninterrupted about 0.005 percent of the time. Nobody runs a 10,000 GPU day and expects no fault. They run it and budget for restarts. What they need is a figure for recovered work.
That figure has a name in the operations literature, goodput, and we have argued before that it decides whether a gigawatt cluster pays at all. A restart service improves goodput only by the amount of idle time it removes. It cannot recover work that was never checkpointed.
Eight thousand detections is a rate you can plan against
Do the division on the vendor’s own figures. Nearly 200 jobs a day across 92 days is on the order of 18,400 job-days, and 8,550 detections against that works out to roughly one detection every two job-days. That is a staffing input, not a failure rate, because a detection can be a false alarm, a straggler warning, or a hang that cleared on its own.
Scale also bends the shape of the problem. An 11 month study of 24,000 A100 GPUs at Meta found hardware failures interrupted fewer than 1 percent of jobs, and those jobs consumed 19 percent of GPU runtime. Small failure rates, large failure costs, concentrated in the longest runs.
The tooling is honest about its own state. Monitor mode is the default, so a fresh install produces advice before actions. The repository calls the code experimental rather than production ready, which tells you to schedule adoption around the tooling maturing, not around a launch.
Checkpoint cadence is the number you actually control
Every restart resumes from the last checkpoint. A four hour interval means a four hour loss on every detection. Shorten the interval and you pay, because a synchronous save blocks every rank on I/O. Teams running long jobs already know this, which is why asynchronous checkpointing and in-process restart are separate projects rather than features of a recovery service.
NVIDIA sells those layers apart. NVRx handles in-job restart, hang detection and straggler mitigation. NVSentinel watches GPU health on Kubernetes and cordons faulty nodes. Recovery coordinates across jobs. The layering is correct. The gap is that none of the three measures time to the first productive step after a restart, and that number reaches the invoice.
Run Recovery in monitor mode on one cluster and compare its detections against your incident log. Measure checkpoint write time as a share of wall clock. Then decide whether the tooling has earned an action policy.
Three questions to take to your own fleet. How long does your longest training job take to reload from checkpoint? What share of wall clock goes to checkpoint writes? And who gets woken up when rank 4,000 stops answering?
Related reading. Our analysis of Meta’s Prometheus goodput figure explains why 85 percent decides a gigawatt cluster, and our piece on NVIDIA AI Cluster Runtime covers how the GPU cluster stack is versioned.
Get the next one before it is old news
Independent analysis of cloud-native infrastructure, Kubernetes and data center economics. No vendor spin.