


Executive Summary
The vLLM team shipped a Kimi K3 decode path that cuts a transformer layer from 23 GPU kernels to 13 and from 130 microseconds to 69. On 16 GB300 GPUs it reaches 842 tokens per second at batch one with DSpark, 1.73 times stock vLLM under an identical speculative setup, and up to 1.88 times at batch one without speculation. Coding agents wrote most of it.
That moves the constraint rather than removing it. The hard part of an agent-authored kernel is not producing it, it is proving it. vLLM’s answer is a fast-track process that keeps each optimization inside the model’s own code, bounds the hardware it must support, and requires the contributor to publish correctness and performance evidence before a maintainer reads a line. The verdict is uncomfortable for anyone running inference. The gains are real and they arrive with an audit bill attached.
Read enough inference release notes and you learn to discount the multiplier at the top. Most kernel work moves one point on a curve and leaves the rest alone. The Kimi K3 decode path changes how many times the GPU launches work inside a single layer, and that count shows up in any profile.
Every decoder layer runs a fixed sequence of small GPU operations, and each launch costs overhead before it does arithmetic. Stock vLLM issues 23 kernels per layer and spends 130 microseconds. The new path issues 13 and spends 69 (the vLLM writeup). Attention output projection is fused into its all-reduce, router and latent projection work is split across tensor parallel ranks instead of repeated on every GPU, and the shared expert runs on its own stream.
Agents wrote the fusions humans keep postponing
The team used agent-assisted development to build a unified CuTe DSL decode path covering attention, MoE and communication across 8 or 16 GPUs. That is not a model generating glue code. It is fused GPU kernels, the part of serving work that takes a specialist weeks and fails quietly when wrong. The post is blunt about the consequence. Agent-optimized inference code is outrunning their review workflow.
Their own audit shows why that matters. A compiler had moved activation reads ahead of a synchronization wait, and the fix restricted that load type to static weights (the pull request). Functional checks would not have caught it. That is the class of defect which turns a fast kernel into a wrong answer at a different batch size.
Without speculation the gains hold across the batch range. On 8 GPUs the path is 1.58 times faster at batch one and 1.31 times at batch 64. On 16 GPUs it runs from 1.88 times down to 1.62 times, topping out at 3,606 tokens per second at batch 64. That is a shorter curve, not a spike at one operating point.
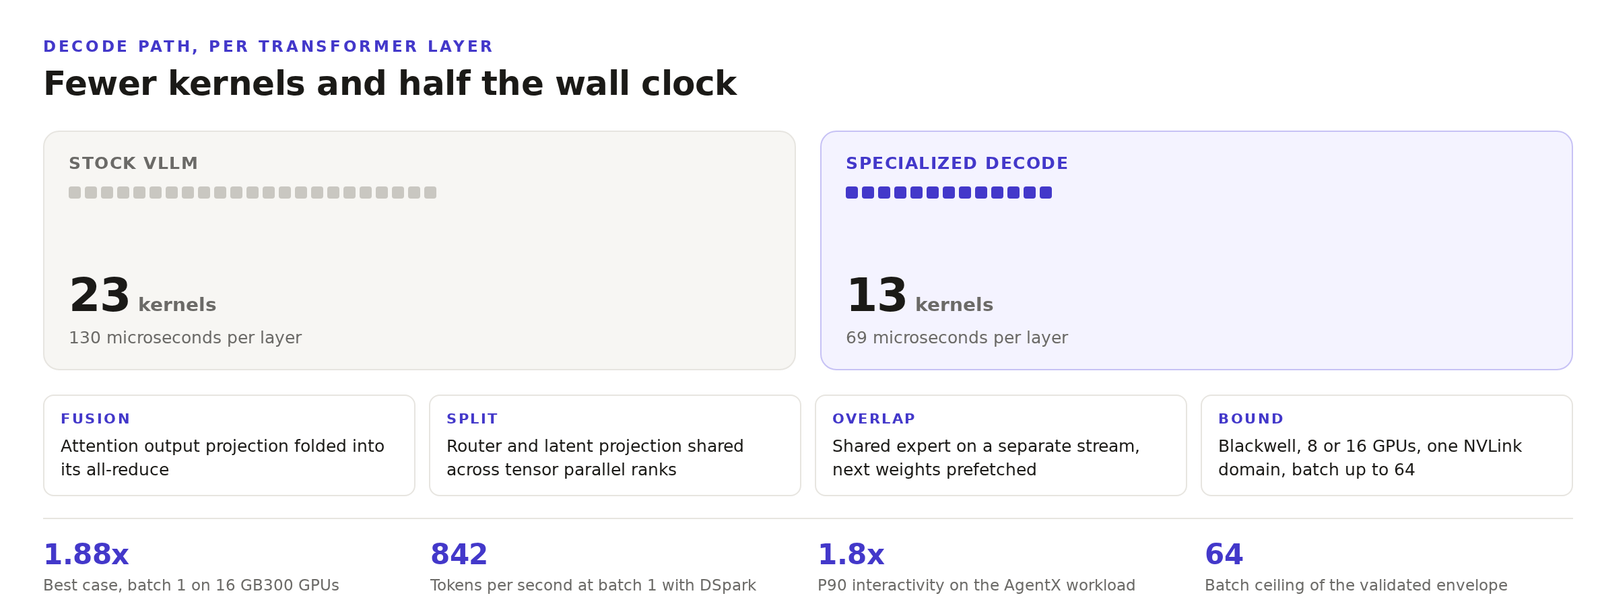
The interactivity number needs a caveat. The team measured 1.8 times higher p90 interactivity on the AgentX coding-agent workload, but the optimized run used 16 GB300 GPUs while the baseline used 8 (AgentX methodology). The per-GPU table above is the honest comparison.
The bottleneck moved to the people who approve code
The proposed fast-track process is the more interesting artifact (the fast-track proposal). Isolate each optimization inside the model’s own code so the blast radius is visible. Bound the hardware, parallelism and batch sizes it claims. Validate with kernel tests and model evaluations, because they answer different questions. Let the contributor run the standard suite on their own GPUs and publish the numbers before asking for a maintainer’s afternoon.
The rules exclude work on purpose. Input preparation, sampling and KV cache management are shared by nearly every deployment, so the fast-track does not let anyone touch them to speed up one model. That is a maintainer deciding the shared path is worth more than a local win.
This is what vLLM kernel optimization looks like when the code is cheap to produce and expensive to trust. Generated performance code is a review problem wearing an engineering costume.
What to test before you flip the switch
The path sits behind an opt-in latency-specialized decode backend with a narrow envelope. Blackwell, 8 or 16 GPUs in one NVLink domain, batches up to 64, and long context by splitting the KV cache across GPUs. Outside it you fall back to standard execution, which is fine if you can see the fallback happen.
Three questions for your own serving team. Does the fallback fire silently under mixed prefill and decode traffic, and does it reach your metrics. Do your correctness checks actually run at batch one and two, or do they run at batch 32 and call it covered. And when an agent-authored kernel lands in your dependency tree, who signs the numerical check?
DeepSeek-V4.1-Flash already runs behind the same switch, and the team reports more than 950 tokens per second per user on Muse Spark Open within two days of release. Serving engines are becoming places where machines tune machines. The organizations that benefit will be the ones whose review process can absorb that. Most cannot yet.
Related reading. Disaggregated inference and the latency tax. Why Rubin changed the throughput curve.
Get the next one before it is old news
Independent analysis of cloud-native infrastructure, Kubernetes and data center economics. No vendor spin.