


Executive Summary
Native histogram support graduated to beta in Kubernetes v1.37 and is enabled by default. Every core component now emits latency and duration metrics in the Prometheus native histogram format alongside the classic bucket series. Affected time series drop by as much as 90 percent, and quantile error falls to roughly 5 percent worst case under the tuned defaults. Existing dashboards keep working because both formats ship in one payload. The risk sits downstream, not in the upgrade. The monitoring stack on the other end has to be new enough to read the new format, and that is the check most clusters have not run.
The maintainers have set the direction. Native histograms head for general availability, and static classic buckets are slated for eventual retirement. Every cluster that upgrades to v1.37 is already emitting the new data whether anyone asked for it or not.
Kubernetes v1.37 landed on August 26, 2026. The release carried 67 enhancements, from gang scheduling for AI jobs to autoscaling that reaches zero pods. The change that reaches deepest into daily operations is quieter. Kubernetes now reports its own latency metrics in a new format by default.
The feature is native histograms. It moved from alpha to beta, and the feature gate is on. Your cluster is already emitting the new data.
Classic histograms were a guess made before the measurement
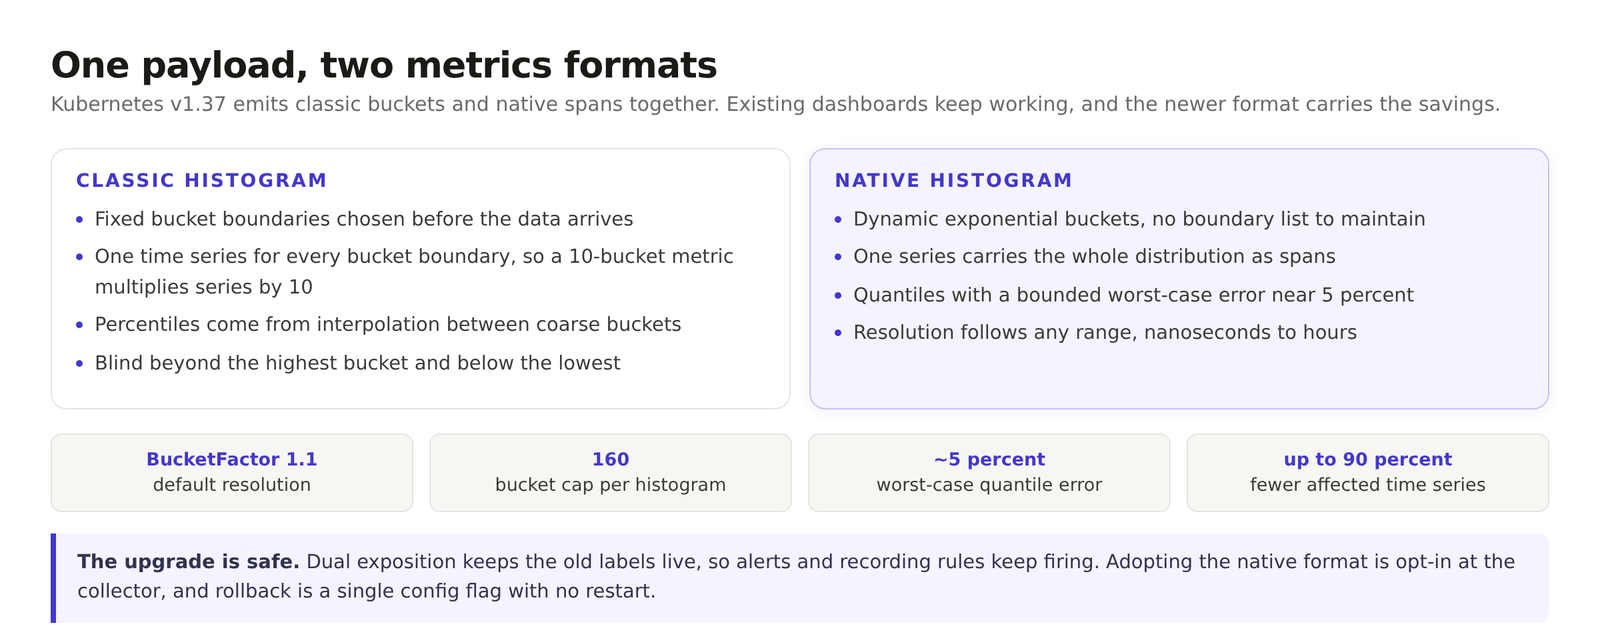
Countless Kubernetes latency metrics rest on classic Prometheus histograms. The metric author fixes the bucket boundaries up front, the familiar 0.005, 0.01, 0.025 ladder. That works until the workload moves. Shift latency into microseconds and the low end blurs. Push the tail past the highest bucket and the long requests simply vanish from the chart.
Two more problems come with the design. Each bucket boundary exports as its own time series, so a ten bucket histogram multiplies the series count by ten. That fans out into memory in Prometheus and storage in the time series database. And percentiles get calculated by interpolation between coarse buckets, which makes the number an estimate dressed up as a measurement.
The third flaw is the one that shows up on the invoice. Series count is the line item.
Native histograms replace static buckets with math
Native histograms arrived through KEP-5808. They swap fixed boundaries for dynamic exponential buckets. Instead of a separate series per boundary, one series carries the full distribution as a schema of spans and a scaling factor.
Three things follow. Resolution adjusts automatically across any range, from nanoseconds to hours, with no boundary list to maintain. Series counts fall by as much as 90 percent on the affected metrics. And quantiles carry a bounded worst case relative error of about 5 percent under the default settings, which is tighter than most teams can get by hand.
Kubernetes wires the support into its shared metrics package. The kube-apiserver, kube-scheduler, kubelet, kube-controller-manager, and kube-proxy all inherit it without a per component change. Defaults settle on a bucket factor of 1.1 and a cap of 160 buckets per histogram, which keeps component memory bounded even under ugly distributions.
The upgrade is safe, and the follow up is the real work
The design goal was zero disruption, and it holds. Components use dual exposition. Classic buckets still ship right next to the native spans in the same payload. Dashboards, alerts, and recording rules that read the old labels keep working untouched. The official notes live on the Kubernetes blog.
So the upgrade itself is low risk. Point Prometheus at the native format and you start banking the storage savings and the sharper quantiles. If it goes wrong, set scrape_native_histograms to false in the scrape config and you are back on the classic path with no restart. Disabling the NativeHistograms feature gate on the components also works, though that one needs a restart. The full reference sits in the Kubernetes documentation.
The realistic blocker is your Prometheus version and your remote write endpoint. Not every backend understands the newer payload yet. Confirm that before you plan the switch.
Kubernetes is now at 82 percent production adoption across container users, which means this format change touches nearly every serious cluster. The team behind it wants native histograms at general availability in a future release. The takeaway is short. Every cluster that upgrades is already emitting the new format. The only open question is whether the monitoring stack on the other end is reading it.
If you run Prometheus at any scale, this is a good week to check the version, confirm the remote write target accepts the format, and decide whether the older bucket series are still paying their way.
Related reading. Why Kubernetes for AI is not Kubernetes for apps covers where these metrics matter most. OpenTelemetry’s graduation covers the other half of the pipeline. The container runtime wars explain the layer underneath.
Get the next one before it is old news
Independent analysis of cloud-native infrastructure, Kubernetes and data centre economics. No vendor spin.
[…] reading. Kubernetes 1.37 switched native histograms on by default covers the observability half of the same release. Why Kubernetes for AI is not Kubernetes for apps […]