


Executive Summary
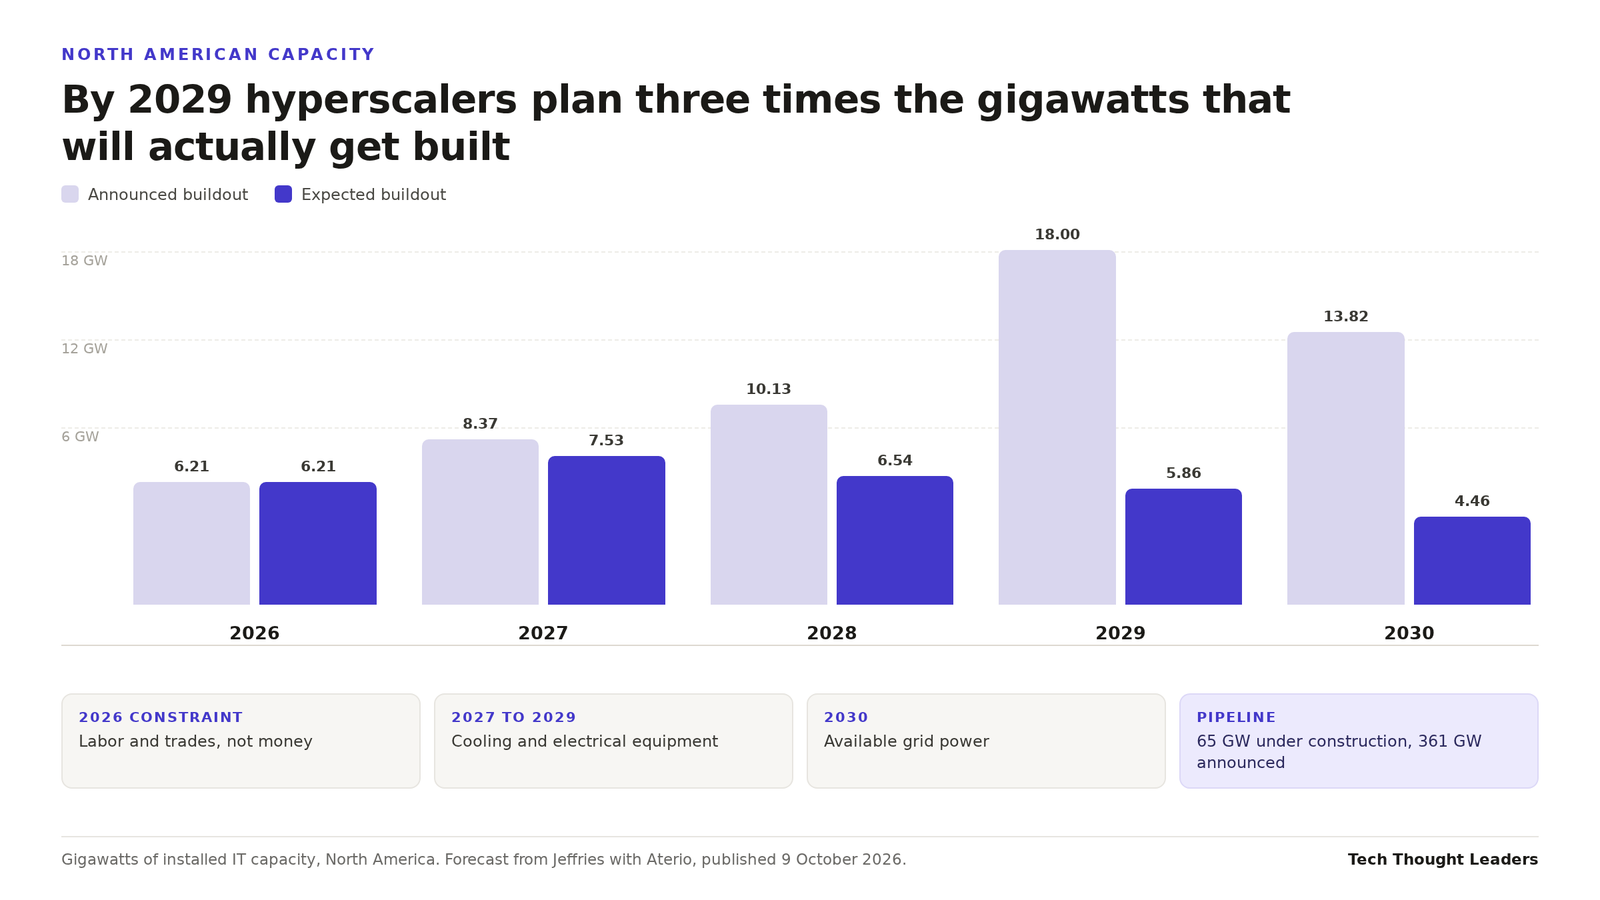
Announced AI capacity and delivered AI capacity are now separated by a factor of three. Jeffries, working with Aterio, tracks about 65 GW of North American data center capacity under construction and another 361 GW announced, then discounts both for labor, electrical equipment and politics. Its expected hyperscaler build is 7.53 GW in 2027 against 8.37 GW announced, 6.54 against 10.13 in 2028, 5.86 against 18.00 in 2029, and 4.46 against 13.82 in 2030. Even the bull case assumes delays and cancellations.
The binding constraint moves every year. Labor and trades bite first, in 2026. Cooling and electrical equipment bind from 2027 through 2029. Grid power takes over in 2030. That sequence matters more than the total, because it tells an operator what to contract for and when. The verdict is that an AI data center capacity forecast built on announcements is wrong by roughly two to three times, and the error grows the further out the plan reaches.
The number infrastructure buyers should carry into 2029 is not 361 gigawatts. It is 5.86.
Jefferies managing director Jonathan Petersen put the setup plainly in an October report. The AI industry has a data center problem, and it is not demand. Inference and frontier model training demand is growing faster than developers can bring capacity online. His team measures a pipeline of roughly 65 GW under construction, about 140 percent of what is installed today, and another 361 GW of announced projects, roughly 760 percent.
Those are intentions. The value is in the conversion rate.
The gap widens the further out you plan
For hyperscalers in North America the expected build sits close to the announced build in 2026, at 6.21 GW either way. That close because the year is nearly done. From there the two lines separate. About 7.53 GW of the 8.37 announced in 2027. Then 6.54 of 10.13. Then 5.86 against just under 18. Then 4.46 against 13.82.
Across the whole market, not just hyperscalers, the model expects 12.9 GW of new capacity in 2026 and 18 GW in 2027. That curve is real and steep. It is also far below what the announcements imply, and the discount is deliberate. Petersen’s method looks at the probability each project completes rather than taking operator promises at face value.
The constraint that bites changes every year
This is the part planners get wrong. People treat capacity as one bottleneck and pick a number to blame. The model says the bottleneck rotates. Labor and trades are the biggest damper in 2026. Cooling equipment and electrical equipment take over from 2027 through 2029. Available grid power becomes the binding constraint in 2030.
Petersen’s argument is that single-factor analysis misses the point. Watching interconnects, or hyperscaler capex, or chip sales in isolation tells you almost nothing. Moving a project from pipeline to online capacity needs all of those things plus available labor, manufacturing of electrical and cooling gear, and a political environment that does not actively obstruct it.
Which explains why even the optimistic scenario is cautious. The bull case is supply chains easing somewhat for construction, not clearing. The bear case adds the labor shortage, rising political pressure on operators to pay their share of electricity costs, and growing local skepticism about the benefit to host communities.
Contract against the constraint, not the announcement
The macro number is doing something unusual too. US Census Bureau data, adjusted to 2021 dollars, shows data center construction spending turning up and accelerating from November 2022, when the generative boom started. Through August 2026 that spending has been offsetting declines in commercial and residential construction. Data centers are holding up a large piece of the construction economy while other building work falls away.
For anyone buying capacity, the practical read is short. If a 2029 expansion depends on a single announced campus coming online, price the slip. Ask which input the project depends on and when that input is the scarce one. A 2028 build competes for cooling and switchgear. A 2030 build competes for grid power, which has a permitting clock measured in years and no substitute.
Three questions worth putting to any capacity plan on your desk. Which year does the plan assume capacity that the forecast says will not exist? What happens to your unit economics if 2029 delivers 5.86 GW instead of 18? And if the constraint moves from equipment to power, does your contract say who absorbs the delay?
Sources. The Next Platform carries the full forecast tables, Jeffries published the underlying report, spending data comes from the US Census Bureau and power data from the US Energy Information Administration.
Related reading. We tracked the financing side of this in the week the AI buildout met its cost of capital, and the earlier read from Broadcom and Intel that money, not chips, was the bottleneck. If this forecast holds, capital stops being the binding constraint and physical capacity takes its place.
Get the next one before it is old news
Independent analysis of cloud-native infrastructure, Kubernetes and data center economics. No vendor spin.